Example NFP Charts for the Creighton Method
The Creighton Method is a method of Natural Family Planning that relies on daily observations to understand the menstrual cycle. Each time you use the restroom, you observe your mucus, and record the observation in a chart to track your cycle and fertility over time. You can use this information to decide when to have sex to achieve or avoid pregnancy. An example chart can help you visualize what this looks like. If you’re new to the Creighton Method, seeing an example chart might help you understand what the method entails to decide if it’s something you want to try. While you might see slight variations in the way charts look with different instructors, most charts will look pretty similar to our examples. You can learn more about the Creighton Method at https://creightonmodel.com.
Example Chart

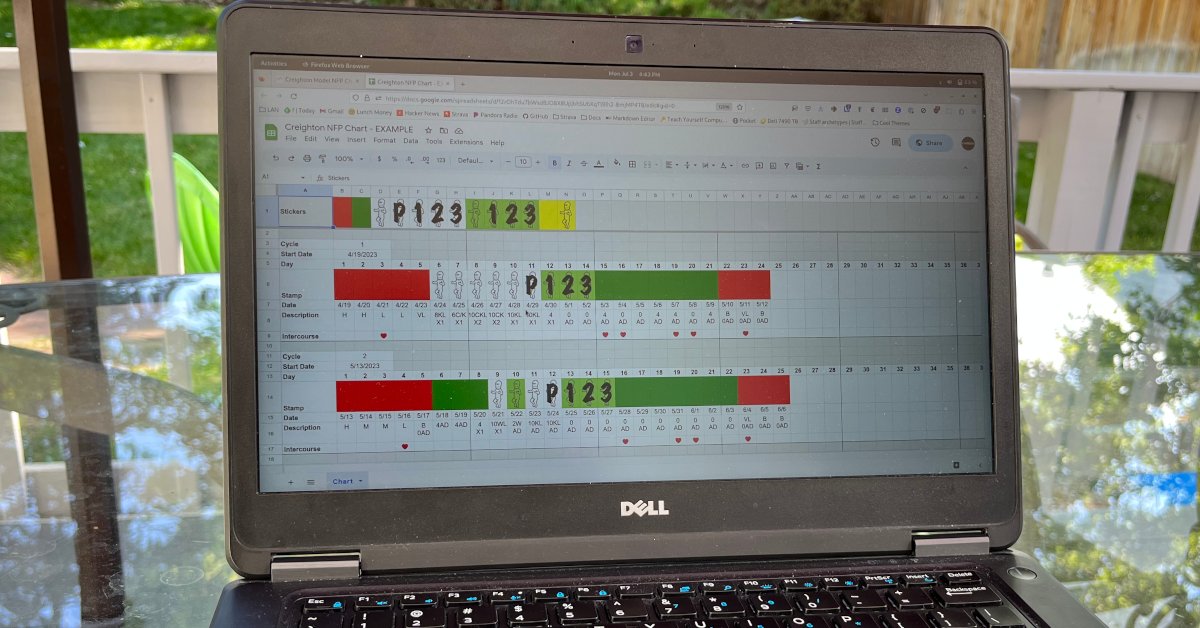
Creighton Method Example Chart
This example chart shows you what it looks like to track your fertility using the Creighton Method. Here are some things you’ll notice:
- You have to record mucus observations daily.
- You assign each day a color (and possibly a baby symbol) according to the observations you see.
- You need proper instruction to understand what the observations mean so your chart is accurate. (See http://www.fertilitycare.org/ to find a teacher.)
- Fertility lasts three days beyond the Peak day.
- This couple was using NFP to avoid pregnancy, so you can see that they abstain from intimacy during the fertile window.
Setup Your Own Chart
If you decide you like our charts and want to use them yourself, you should start with a blank chart rather than copying the demo. Here’s a link for the Creighton Method Chart Template.